II.Ambient Air Environment
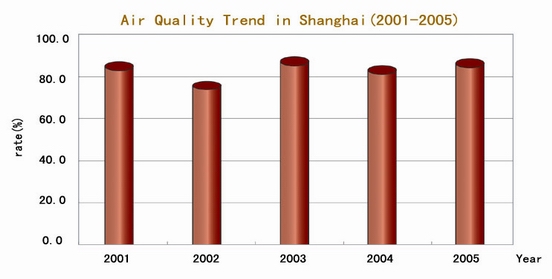
In 2005, there were 322 days evaluated as good-air quality (defined when the city's air quality index reaches Grade II or better), and good-air quality rate was 88.2%. There were 6 days when both PM10 and SO2 became the top pollutants, accounting for 1.6% of the year. One day when both PM10 and NO2 became the top pollutants, 0.3% of the year.
The recent five-year (2001-2005) monitoring data showed that except in 2002, good-air quality rate outnumbered 80% in the other four years. The rate even exceeded 85% from 2003 to 2005. |
|
1.Inhalable Particulate
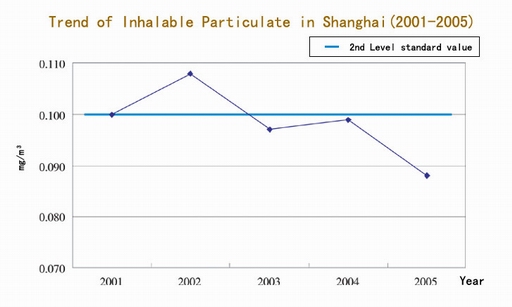
The annual daily average of inhalable particulate in urban area was 0.088mg/m2 in 2005, which met the 2nd standard level specified in National Ambient Air Quality Standard (GB3095-1996), 0.011 mg/m3 declined than in 2004. There were 303 days, 83.0% of the year, monitored when inhalable particulate ranked as the top pollutant.
The recent five-year monitoring data showed that except 2002, the annual daily average of inhalable particulate in urban area in the other four years was lower than the 2nd standard level. The overall pollution status of inhalable particulate was on the decline.
|
|
| 2.Sulfur Dioxide
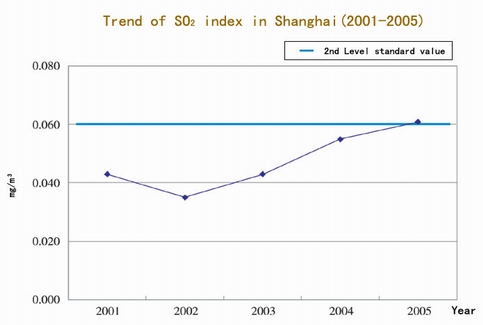
The annual daily average of SO2 in urban area was 0.061mg/m2 in 2005, which slightly exceeded the 2nd standard level specified in National Ambient Air Quality Standard (GB3095-1996), 0.006mg/m3 down than in 2004. There were 49 days, 13.4% of the year, monitored when SO2 ranked as the top pollutant.
The recent five-year monitoring data showed that except 2005, the annual daily average of SO2 in urban area in the other four years was lower than the 2nd standard level. However, the increasing tendency of SO2 emission is definitely due to fast economic growth and accumulating demand for energy consumption. |
|
| 3.Nitrogen Dioxide
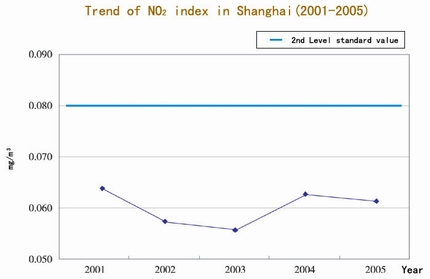
The annual daily average of NO2 in urban area was 0.061mg/m2 in 2005, which was compliant with the 2nd standard level specified in National Ambient Air Quality Standard (GB3095-1996), and which was 0.001mg/m3 down than in 2004. There were 6 days, 1.6 % of the year, monitored when NO2 ranked as the top pollutant.
The recent five-year monitoring data showed that the annual daily average of SO2 in urban area was lower than the 2nd standard level. The overall level of NO2 emission was maintained.
|
|
| 4.Acid Rain and Dust
The average pH value of precipitation was 4.93 and the occurrence of acid rain was 40% in 2005, increased by 7.3% than in 2004.
The annual average amount of dust citywide was 8.8 tons/km2 per month and the annual average amount of dust on roads was 22.4 tons/km2 per month, which were 1.2 tons/km2 per month and 4.1/km2 per month lower respectively than in 2004.
|
|